What is a JavaScript console screenshot?
If you're experiencing a platform bug and have already reached out to the NLP help center, one thing we may ask for is a JavaScript console screenshot. This bit of information gives us a peek into how Checkology is interacting with your local network and devices so we can better and more quickly address the issue you are experiencing. Below are step-by-step instructions on how to take this screenshot.
Step-by-step instructions on taking a JavaScript console screenshot
Before beginning, please note that the JavaScript console screenshot must be taken from the Checkology account/device that is experiencing the issue. If multiple student accounts are experiencing the same issue, usually one or two JavaScript console screenshots will suffice.
Follow these 5 steps to take and send us a JavaScript console screenshot:
-
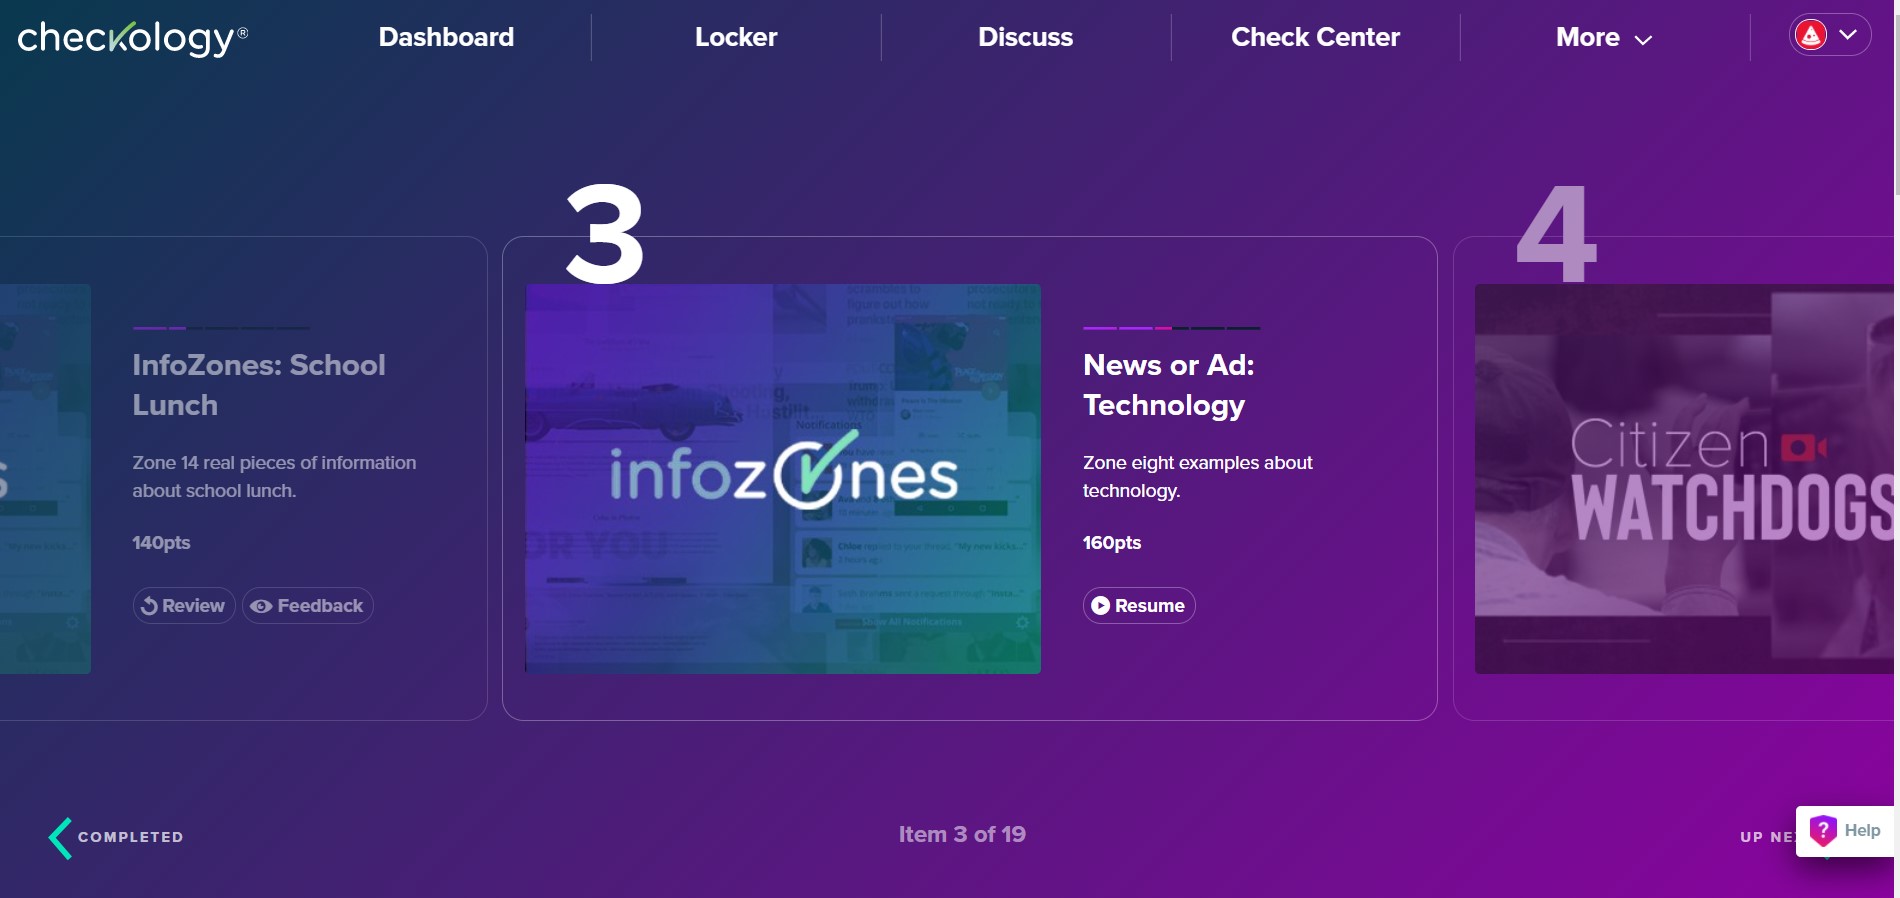
Login to Checkology and navigate to the bug or problem area.
For example, if I am unable to click the "Next" button in a specific lesson element, I would navigate to that specific lesson.
-
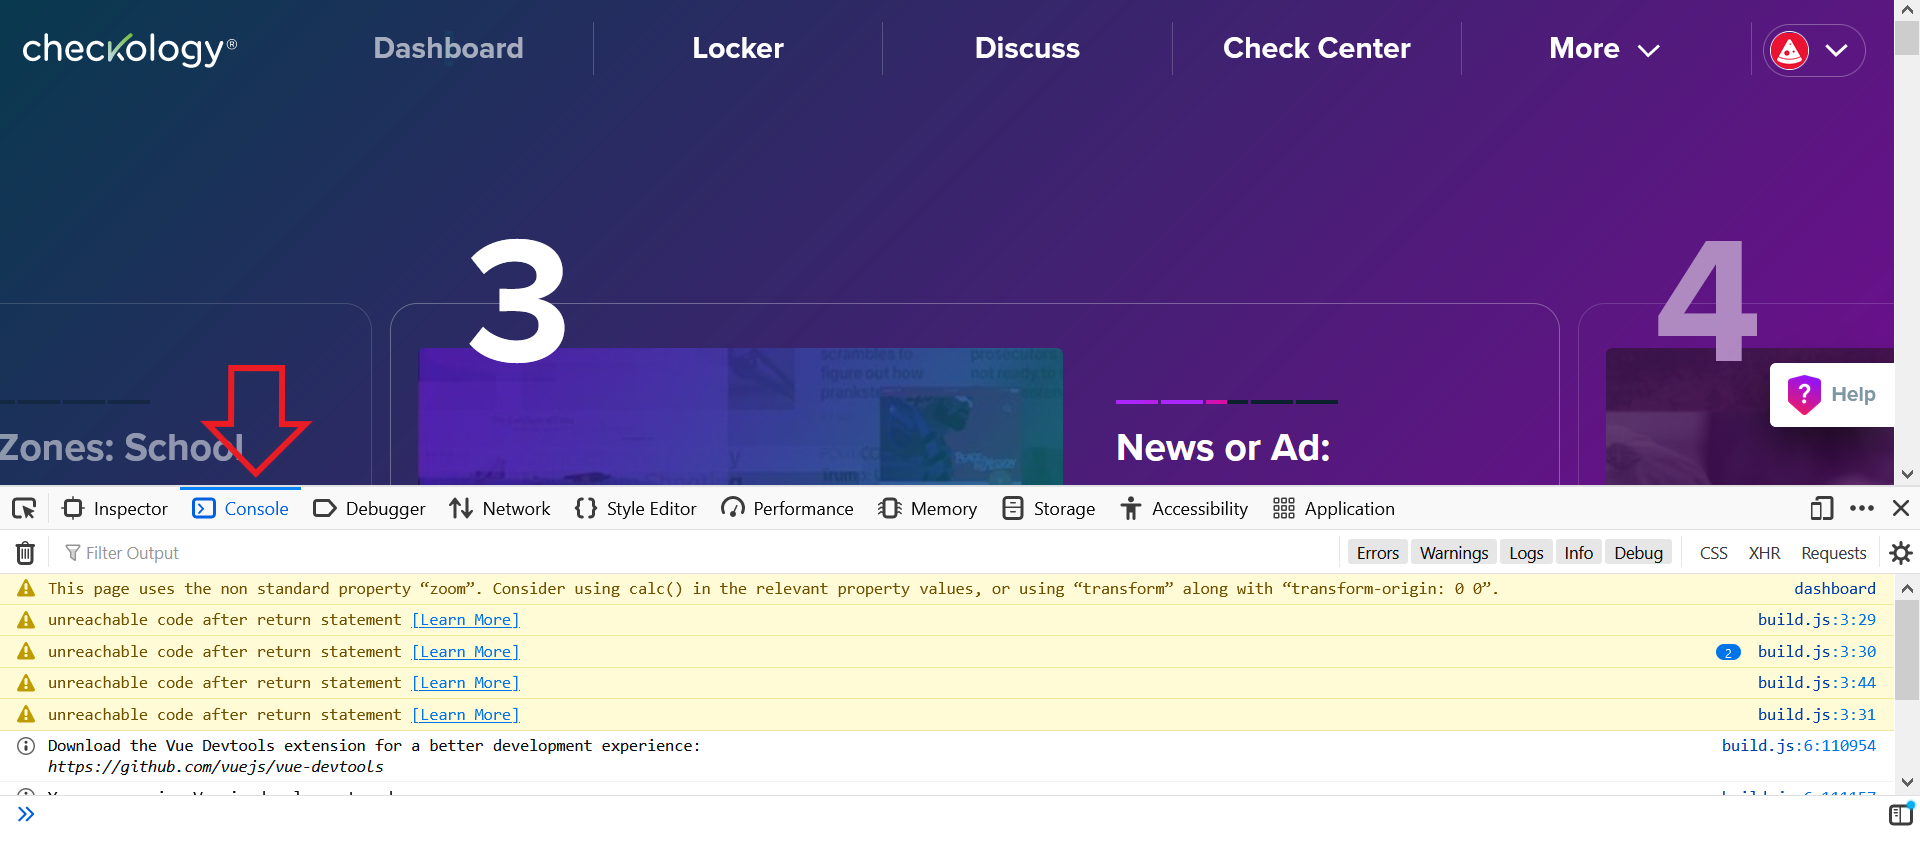
Open the browser's "JavaScript console."
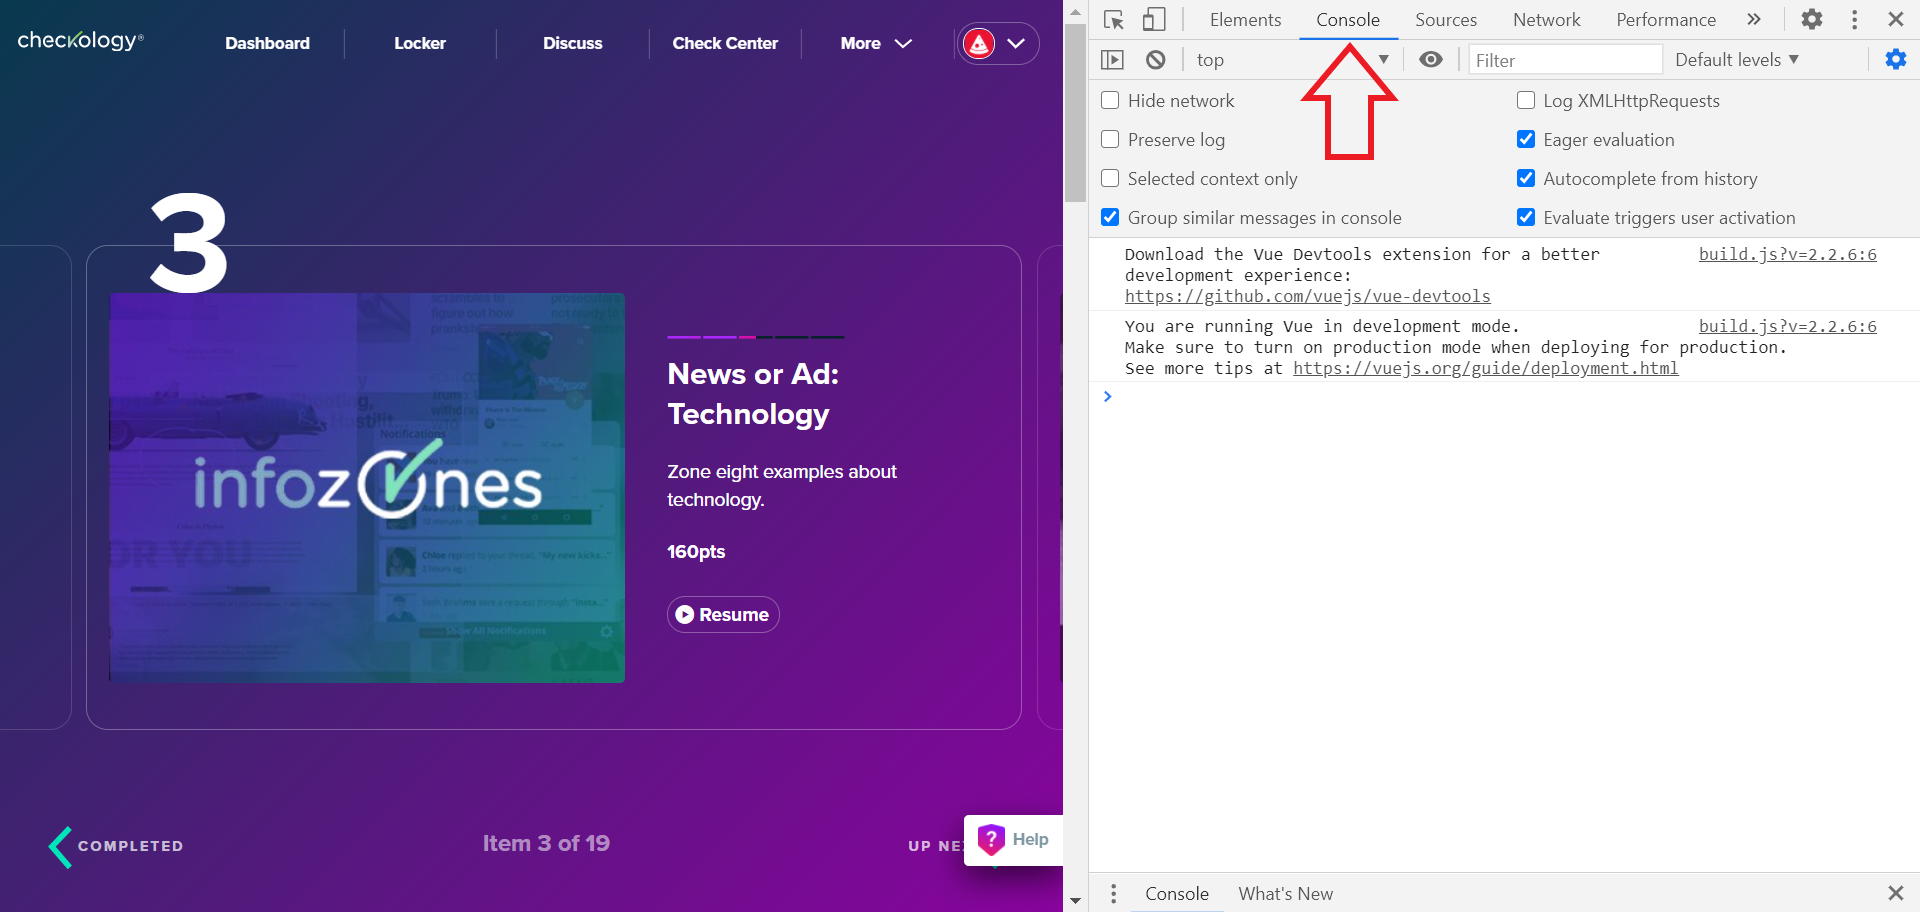
Click the browser options below for browser-specific instructions on how to open the JavaScript console. Once selected, the JavaScript console will appear either to the right or below your screen depending on what browser you are using. Be sure that the "Console" tab is selected on the new window.
 Google Chrome
-
Click on the three dots in the upper right hand corner.
-
Hover over "More tools."
-
Select "Developer tools."
-
Make sure the "Console" tab is selected.
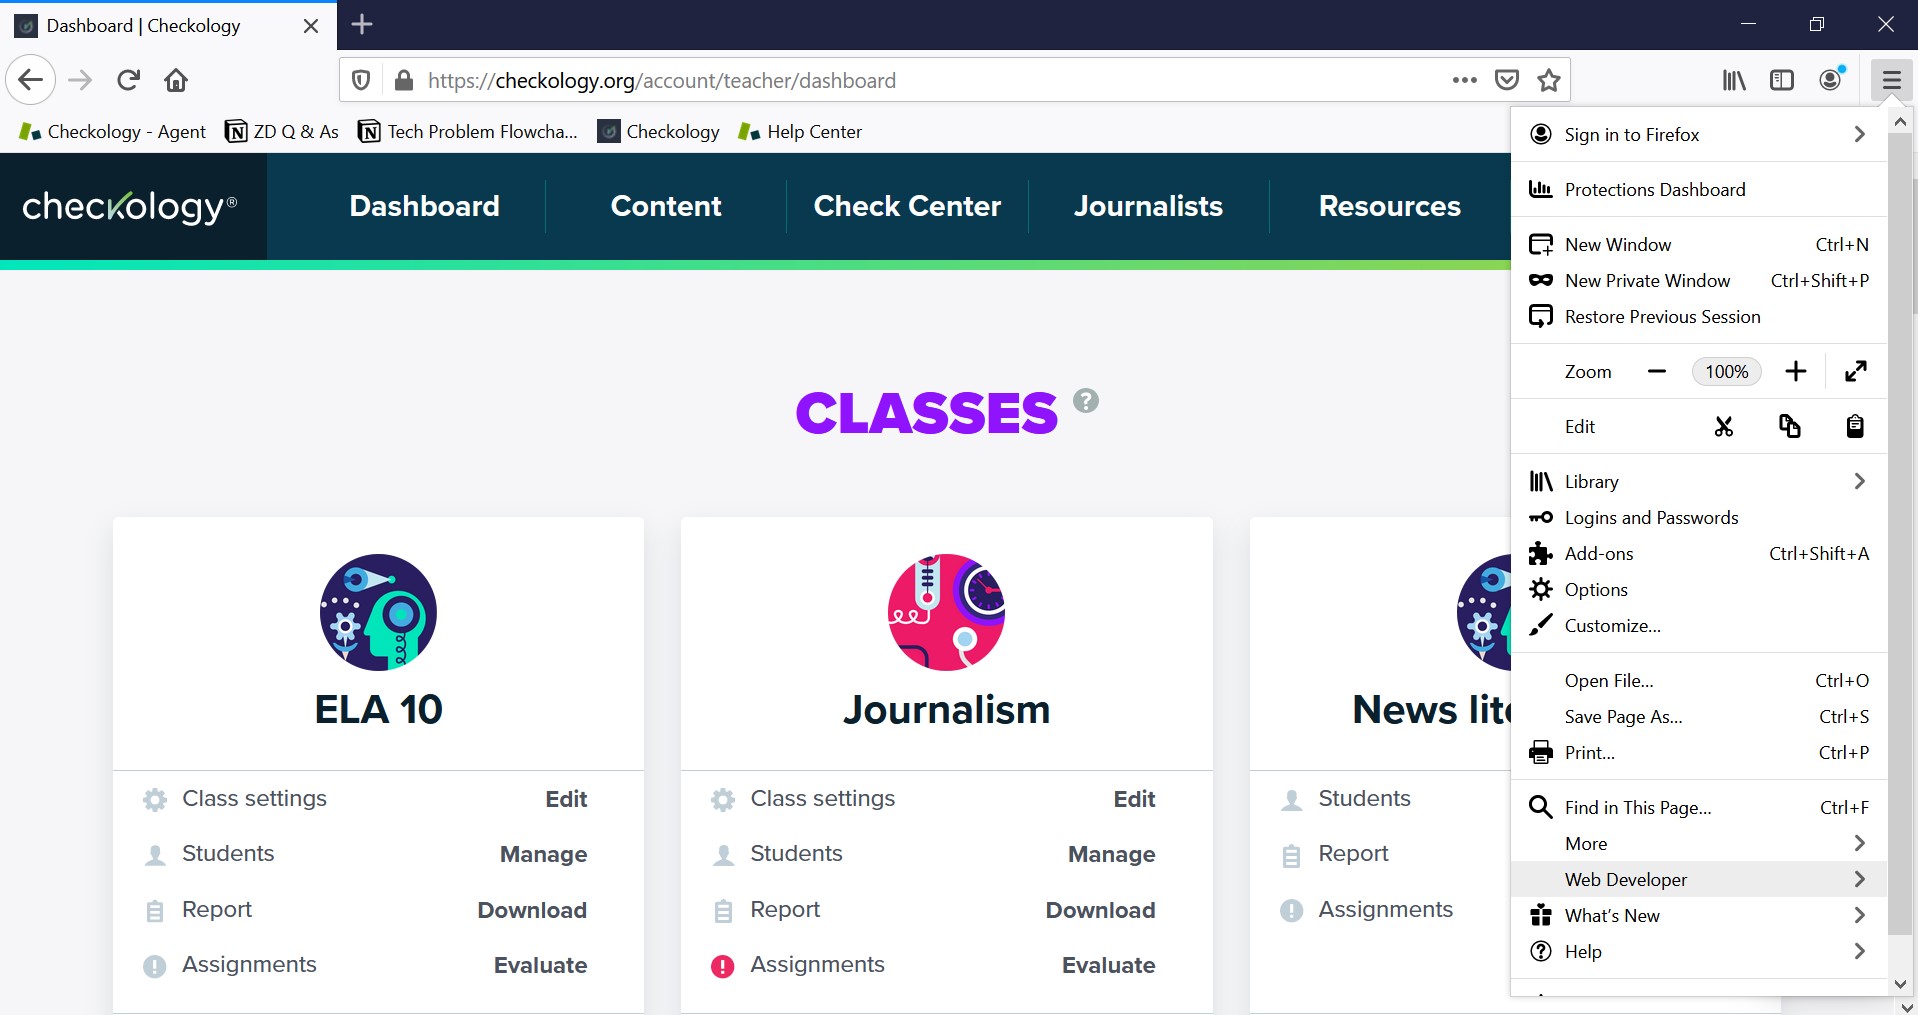
 Firefox
- Click on the three bars in the upper right hand corner.
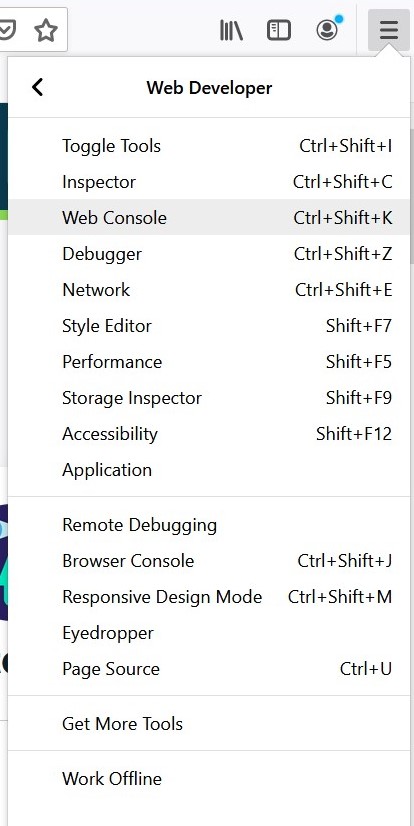
- Select "Web Developer."
- Select "Web Console."
-
Make sure the "Console" tab is selected.
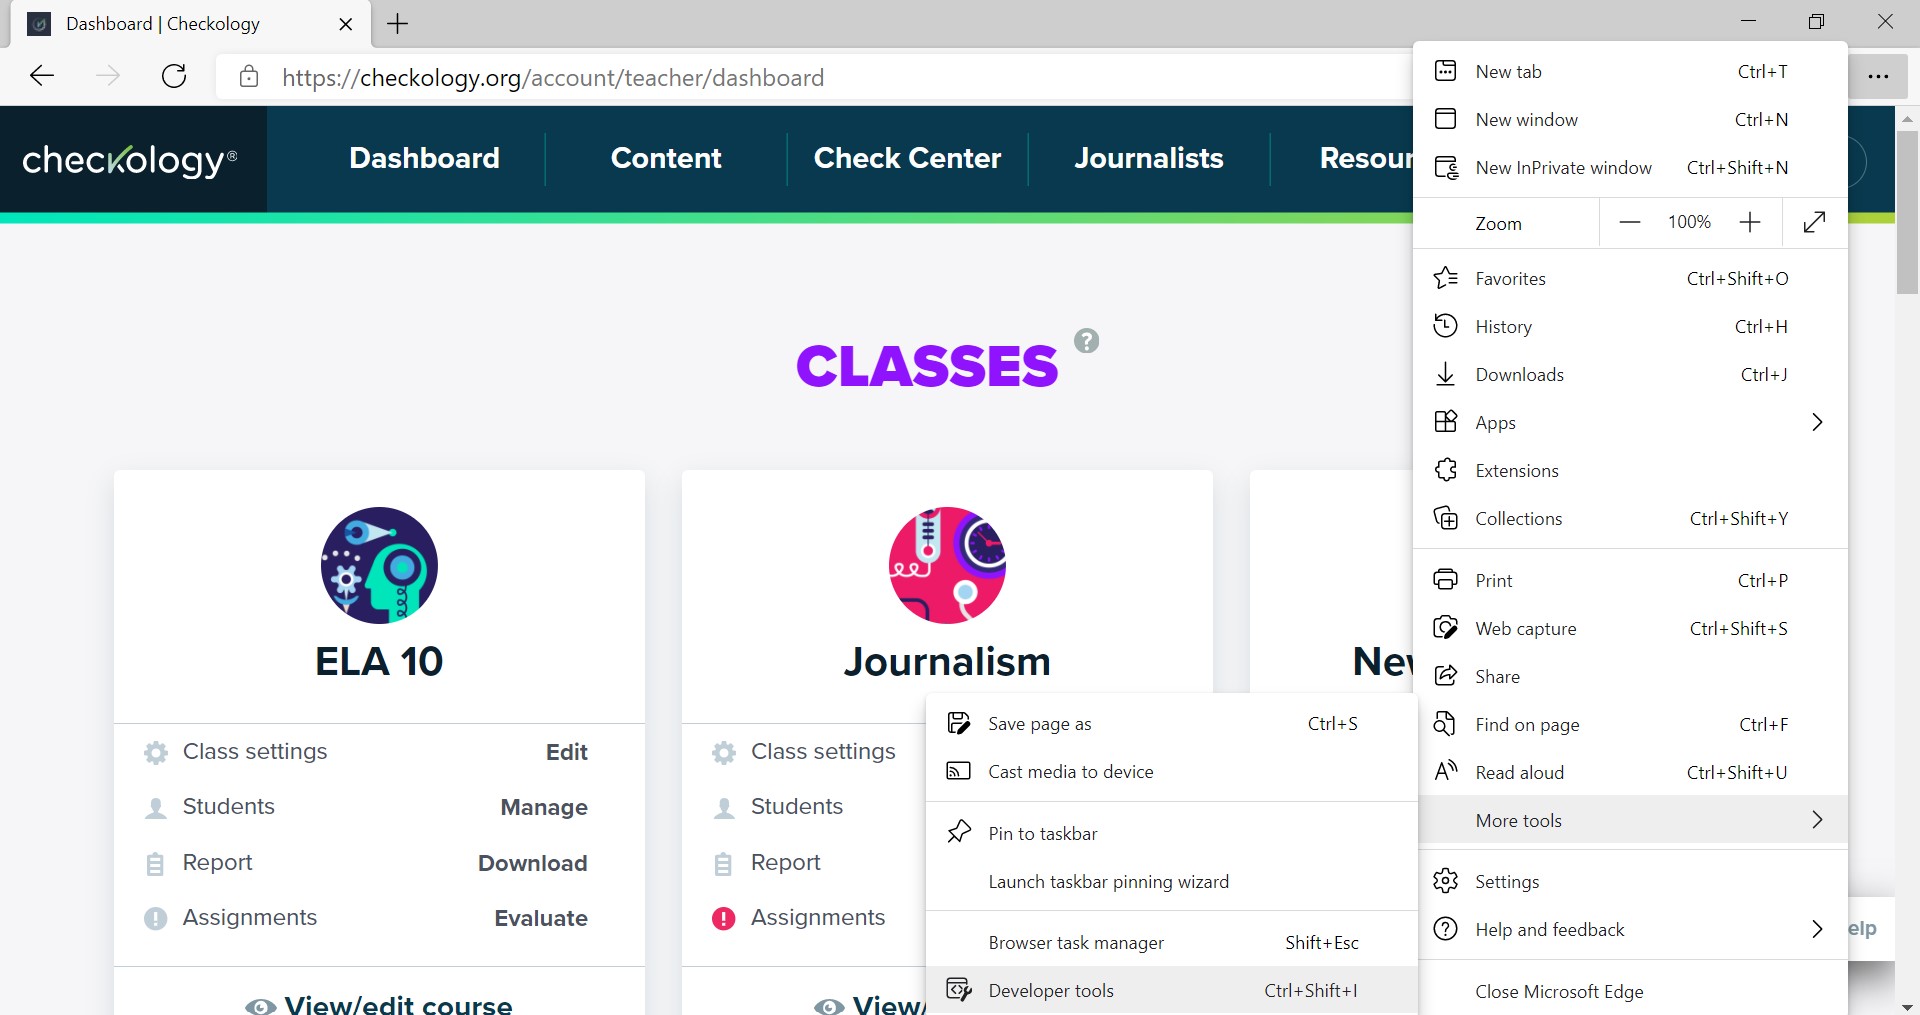
Microsoft Edge- Click on the three dots in the upper right hand corner.
- Hover over "More tools."
- Select "Developer tools."
-
Make sure the "Console" tab is selected.
SafariThis browser is a little tricky because you have to first enable the "Develop" menu item to appear.
If you do not see "Develop" as an option in your Safari menu, first follow these instructions:
- Select "Safari" from the top navigation menu.
- Select "Preferences" from the dropdown menu.
- Select "Advanced" from the options that appear.
- Check the box next to ""Show Develop menu in the menu bar."
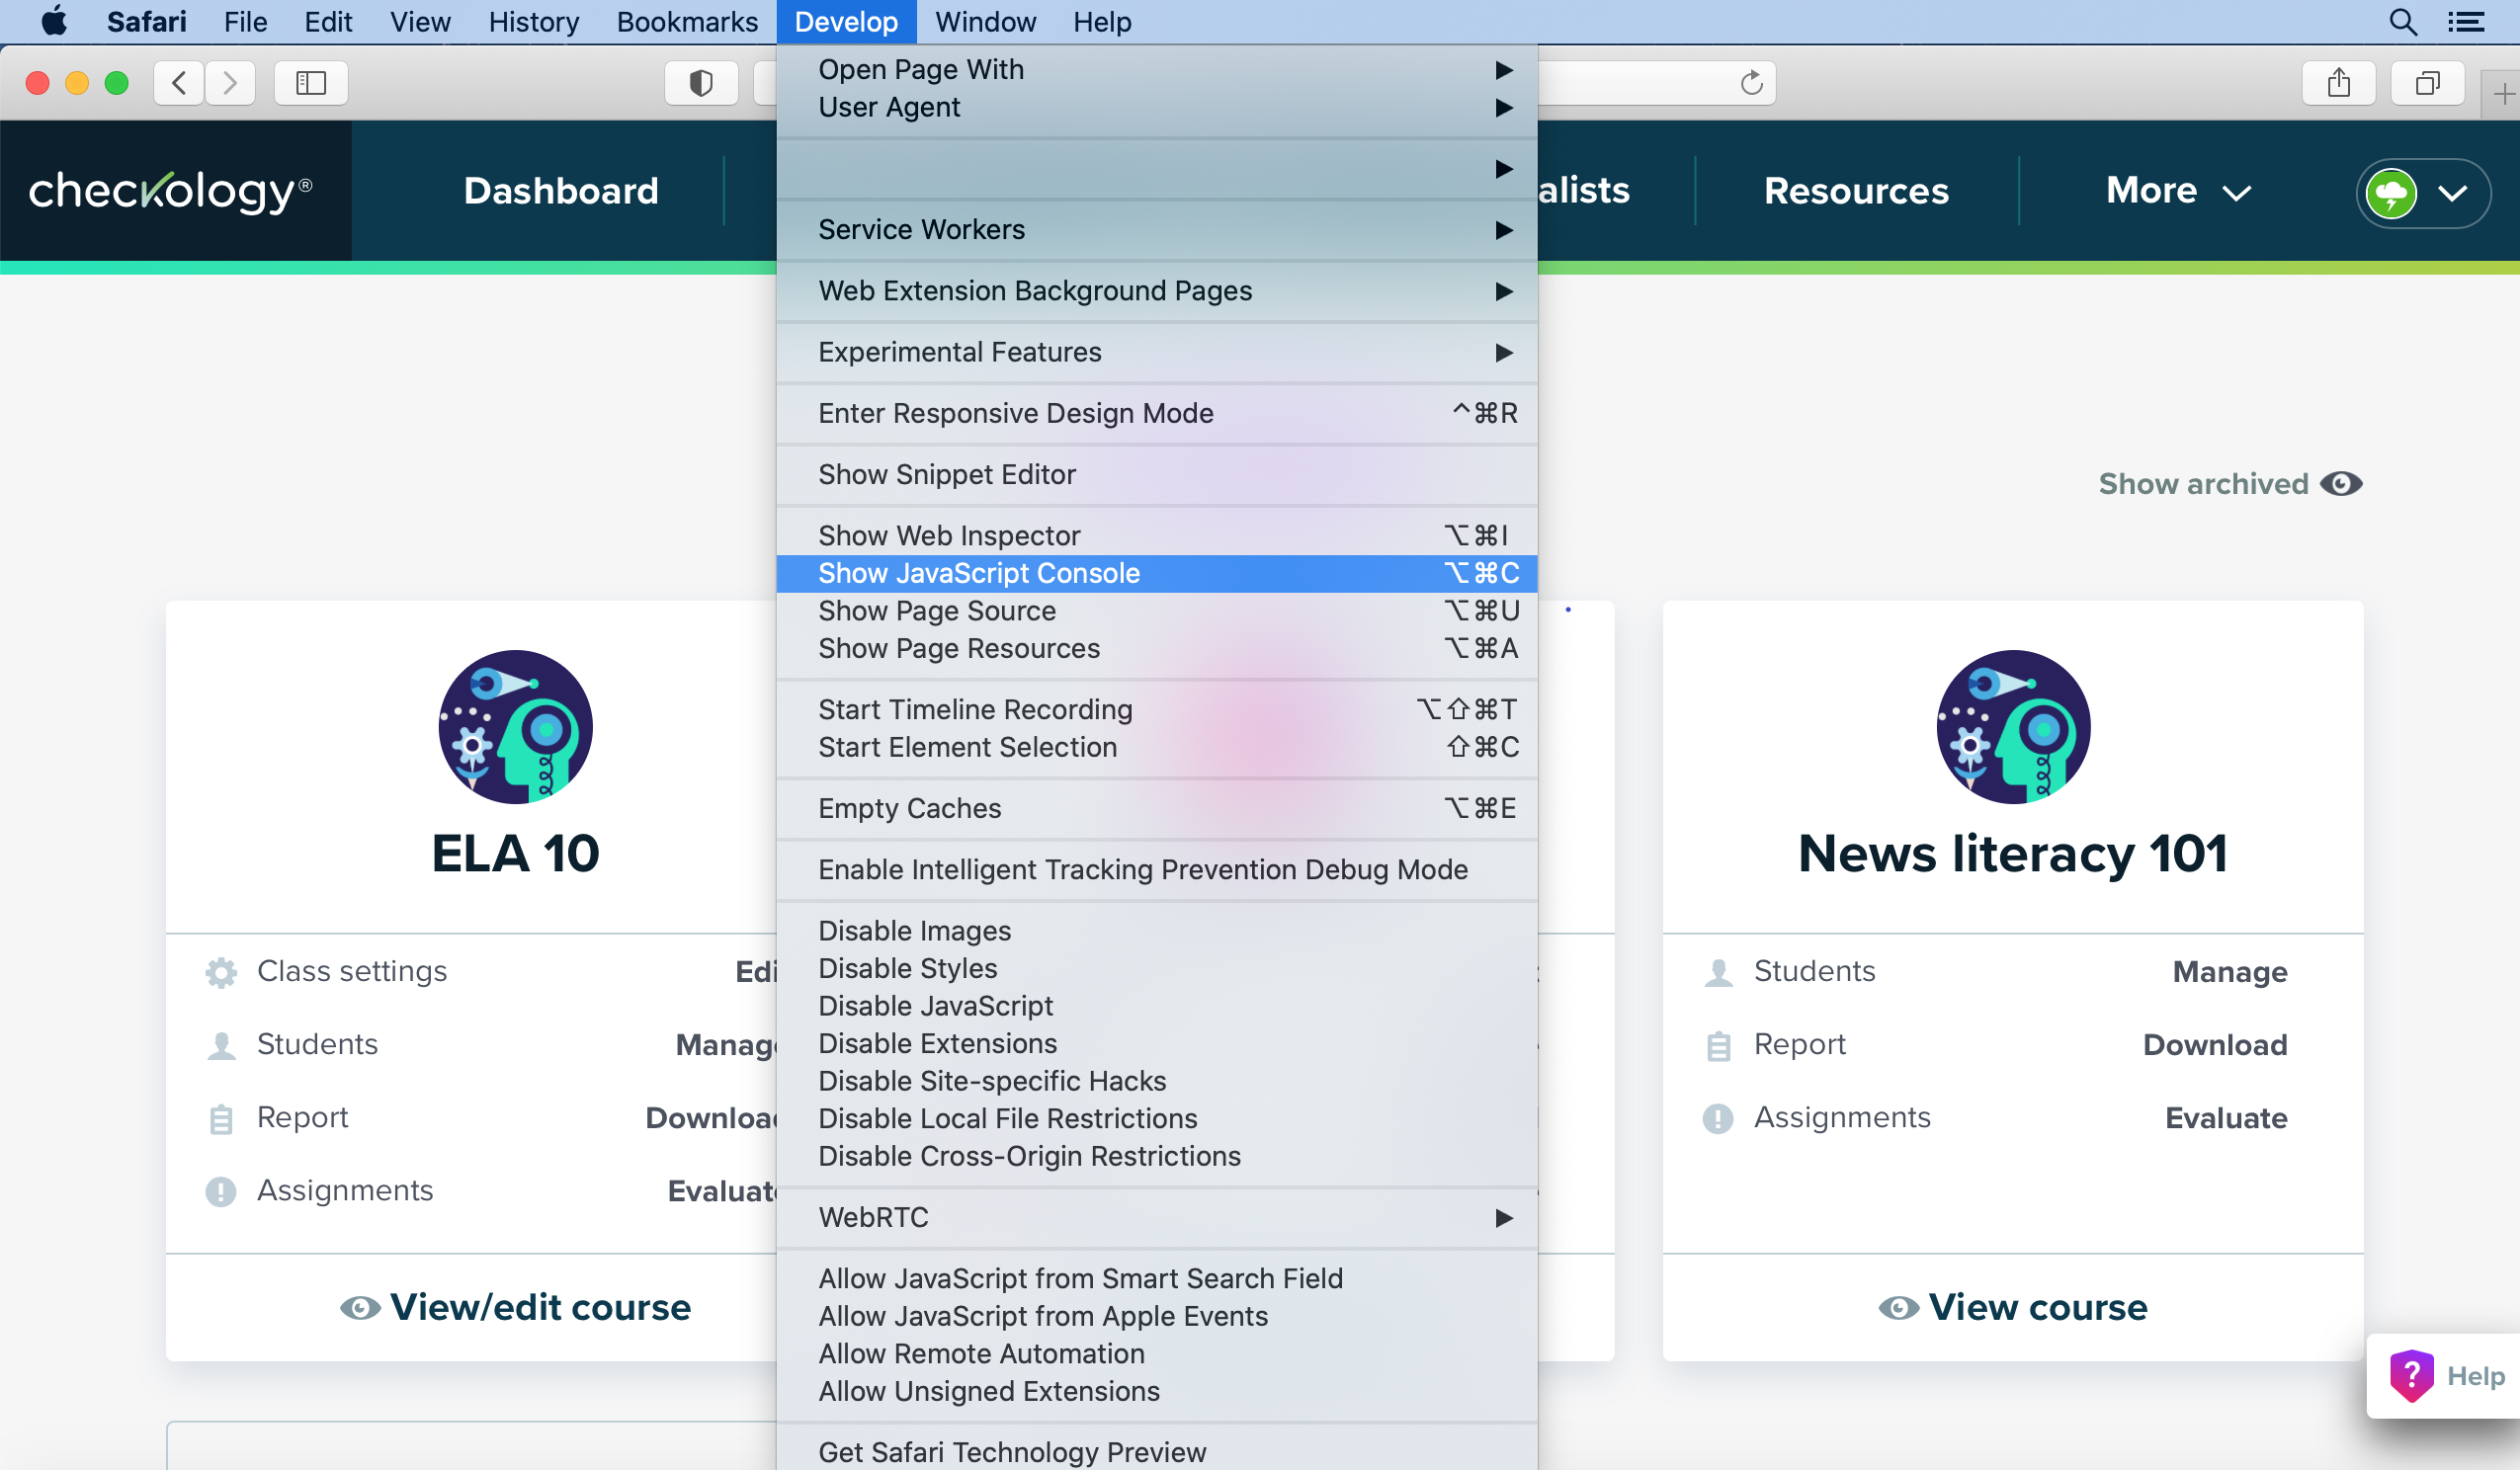
Once you have enabled the "Develop" menu item to appear, follow these instructions:
- Select "Develop" from the top navigation menu.
- Select "Show JavaScript Console."
-
Make sure the "Console" tab is selected.
-
-
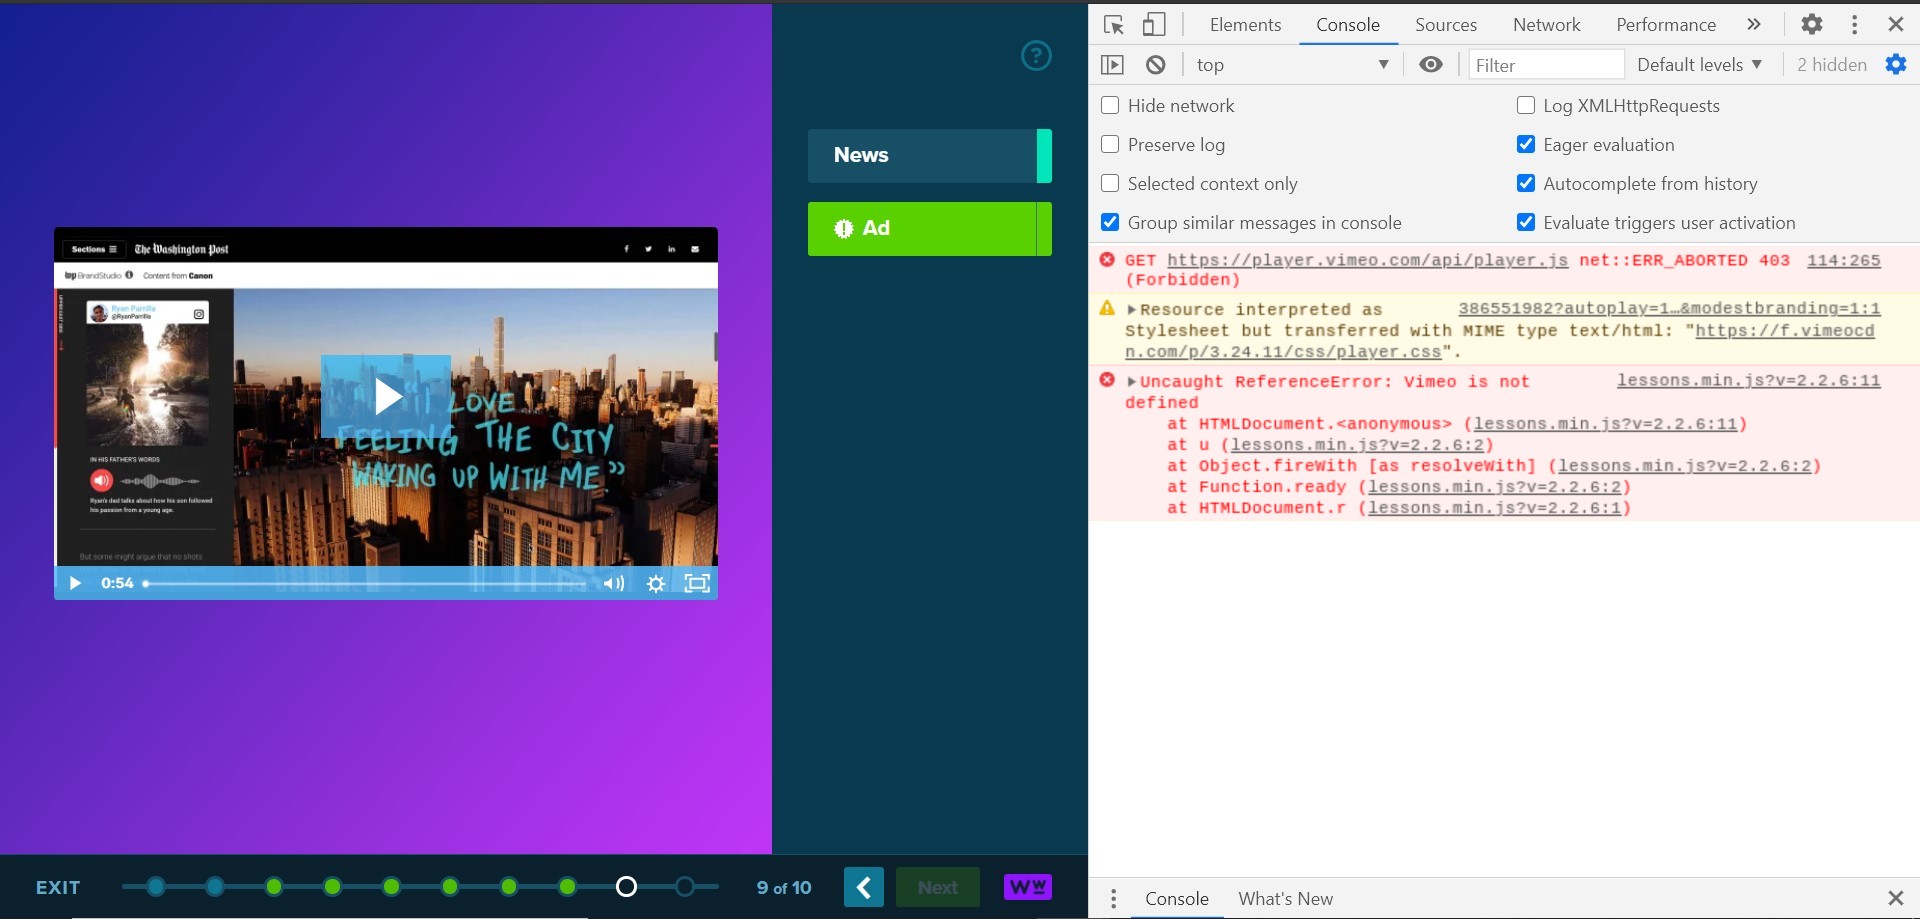
Activate the bug or problem area by clicking whatever is not working properly.
For example, if I am unable to click the "Next" button in a specific lesson element, I would navigate to that lesson element and try to click "Next." As you activate the bug or problem area, your JavaScript console window will change.
-
Take a screenshot or a screen recording of your entire screen.
Be sure to include the entire JavaScript console window in your screen capture.
Tech tip:
Need more info on how to take a screenshot? This article goes over how to take a screenshot on any device or platform, including Windows 10, Mac, and Chromebooks. Just use the table of contents near the top of the article to select your platform.
-
Send us your screenshot or recording.
Feel free to send us the screenshot or recording in an existing Help Center request or start a new request by clicking "Submit a request" on the top right corner of the Help Center. Thank you for helping us troubleshoot the issue!